
`, `
`, `
`, `
- `, `
- `, ``, ``.
* No H1 tag, no intro/outro commentary.* *Overall:* 1,491 sold. Avg price $1,027,853 (down from $1.1M+ but +8.9% YoY). Price per sqft $515.22. List-to-sold: 93.5%. Days on market: 91. Volume down -12.1% vs prior month, -47.2% vs last year.
* *Economic Indicators:* US Unemployment (4.1%), Inflation (3.3%), Florida Unemp (4.6%), Miami Metro Unemp (3.9%). Fed Funds Rate: 3.63%. Mortgage: 6.69%.
* *Neighborhoods:* Surfside ($4.7M+), Bay Harbor ($4.4M+), Bal Harbour ($3.9M+), Key Biscayne ($3M+). Others like Coral Gables, Miami Beach, and Miami are in the $800k-$1.6M range.
* *Floor Premium:* Penthouse (Top 10%) is significantly higher ($1.34M avg, $691/sqft) compared to lower floors ($538k average).
* *View Type:* Ocean View ($1.6M+) vs. Pool/Garden ($1.2M+).
* *Age:* New Construction (2022+) is the highest premium ($2.68M avg), while Classic (Pre-1995) is the lowest ($741k average).
* *Active Buildings:* Specific list provided.* **H2: Executive Summary**
* Integrate economic data here. High interest rates/inflation context vs. Miami’s specific metrics (low unemployment in Miami-Ft. Lauderdale metro).
* Summarize the overall market: Volume is down significantly YoY (-47.2%), but prices have stayed resilient or grown slightly (+8.9% YoY). This suggests a tightening of supply and high demand for premium assets despite macro headwinds.* **H2: Neighbourhood by Neighbourhood: Where the Market Is Moving**
* Group them into tiers: Ultra-luxury (Surfside, Bay Harbor, Bal Harbour), High-End Lifestyle (Key Biscayne, Coral Gables, Coconut Grove), and Core Urban/Beach (Miami Beach, Miami, Sunny Isles).
* Analyze why Surfside commands such a premium ($1,569/sqft) compared to the regional average. It’s about exclusivity and geography.
* Discuss the volume in “Miami” vs other areas.* **H2: The Floor Premium: Why Your Unit’s Height Matters**
* Analyze the jump from Lower (1-25%) to Penthouse (Top 10%).
* Explain *why*: Privacy, exclusive amenities, and “prestige” value. A penthouse isn’t just a higher floor; it’s a different asset class.* **H2: View Analysis: What Each View Type Adds to Value**
* Compare Ocean ($825/sqft) vs. Pool/Garden ($529/sqft).
* Explain the “scarcity premium.” There is a finite amount of oceanfront in Florida.* **H2: New vs Classic: How Building Age Shapes Price**
* Compare New Construction ($745/sqft) to Modern and Established.
* Contrast with “Classic” (Pre-1995). Explain the value proposition of older buildings (often larger layouts, established locations) vs. new ones (amenities, low maintenance).* **H2: Most Active Buildings This Month**
* List the specific buildings provided but only using their aggregate stats.
* NoteMarket Charts
[INSERT CHART HERE — 12-Month Price & Volume Trend]
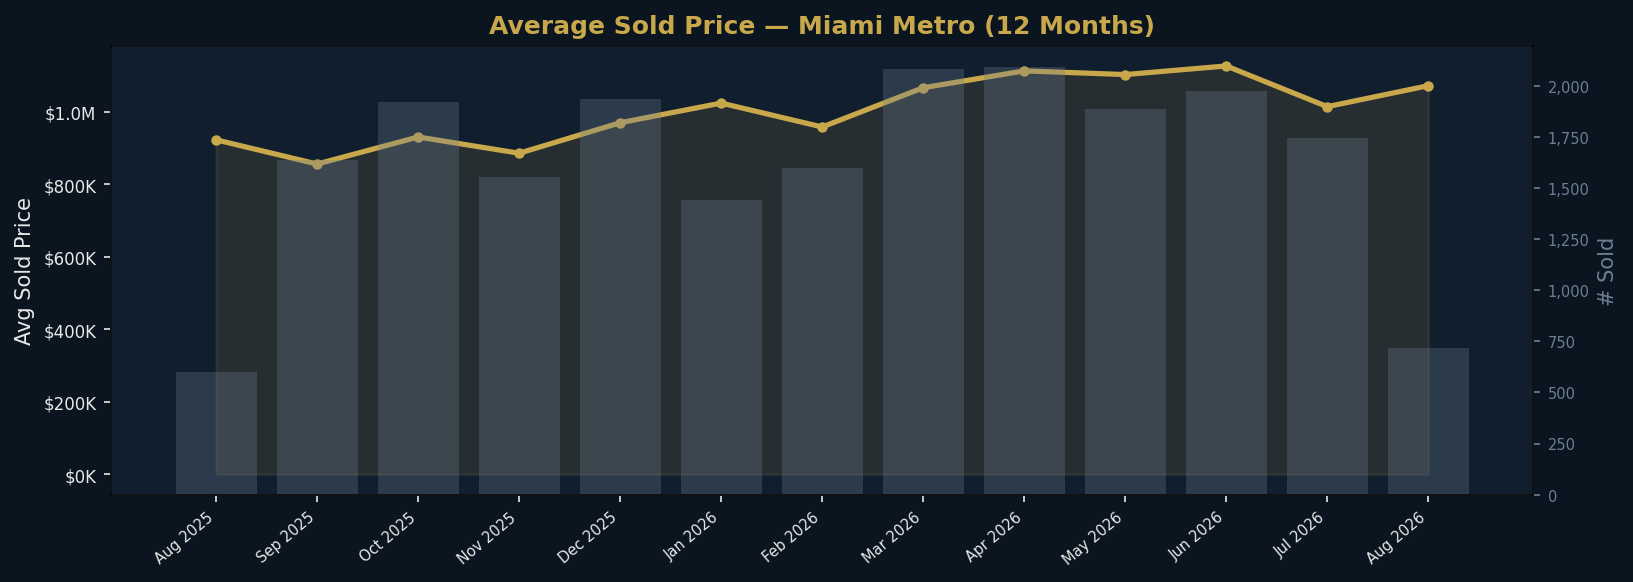
12-Month Price & Volume Trend [INSERT CHART HERE — Neighbourhood Comparison]
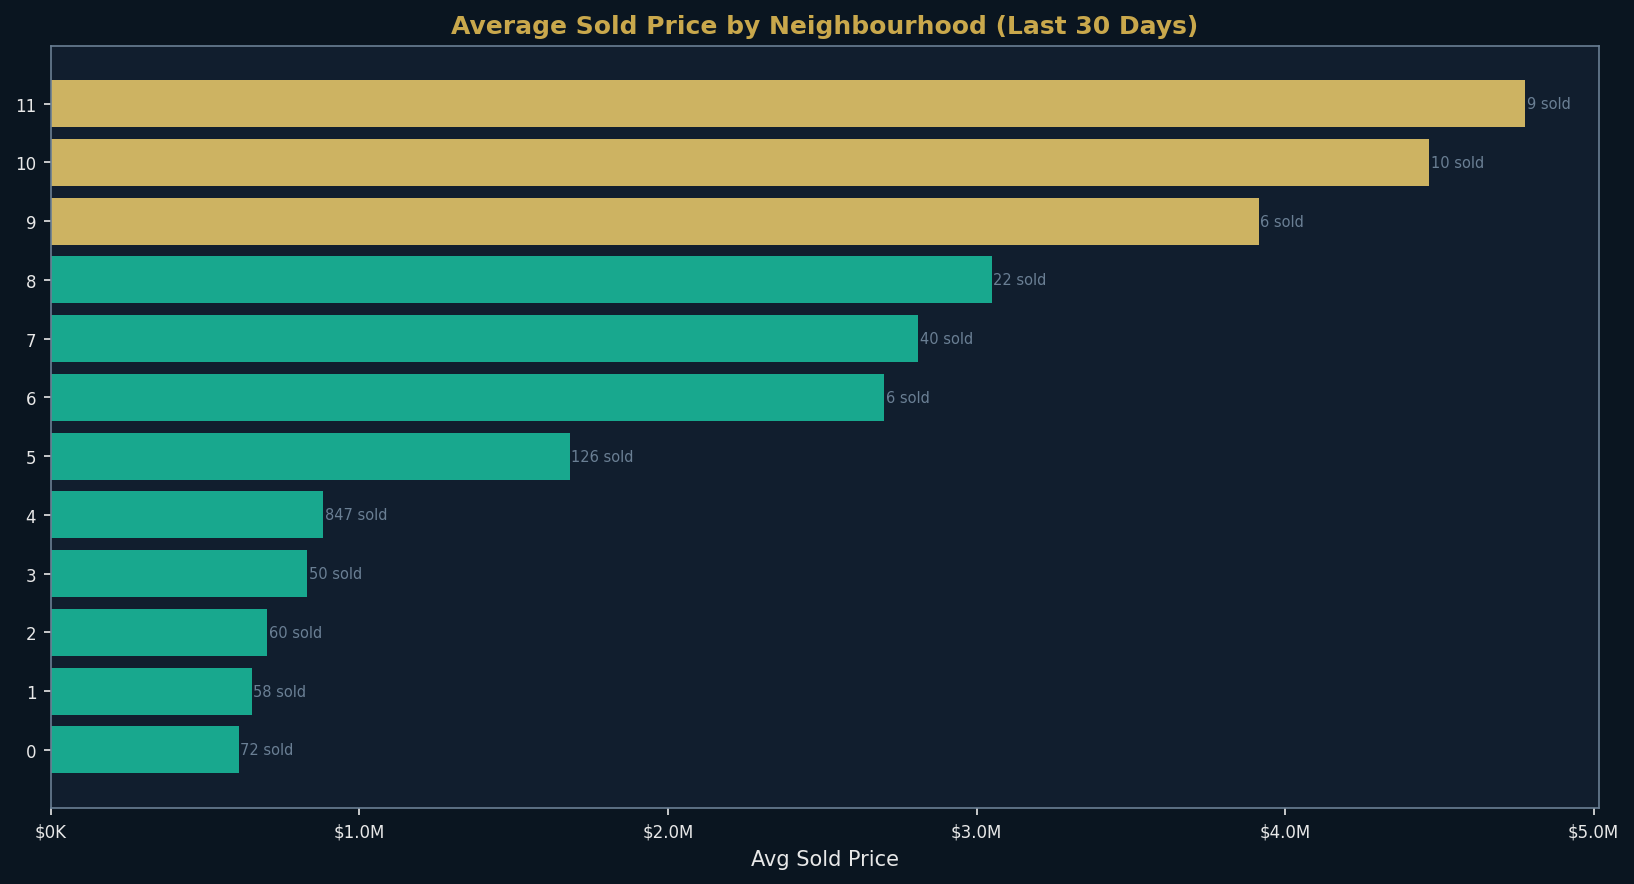
Neighbourhood Comparison [INSERT CHART HERE — Floor Tier Premium]
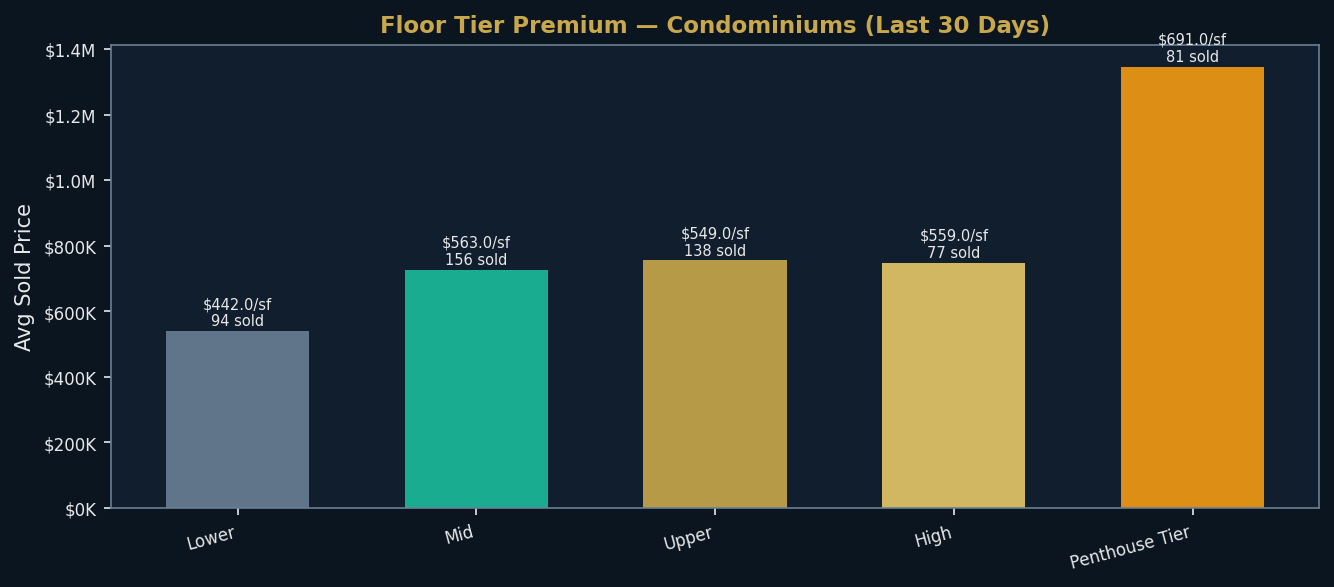
Floor Tier Premium [INSERT CHART HERE — View Type Premium]
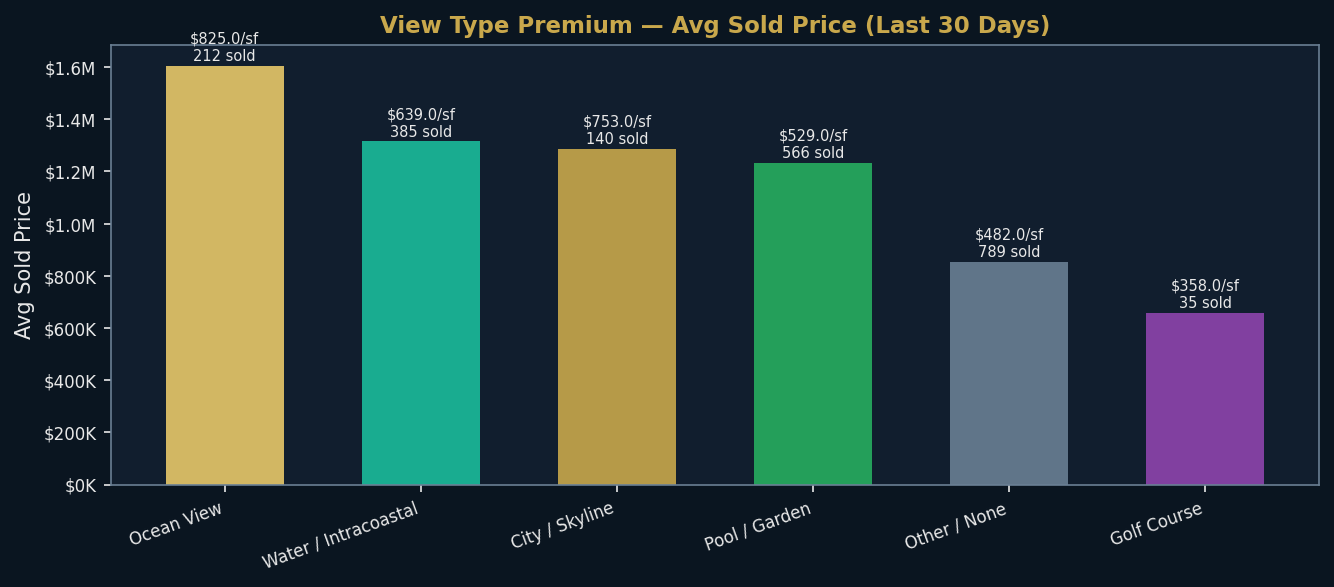
View Type Premium [INSERT CHART HERE — Building Age Premium]
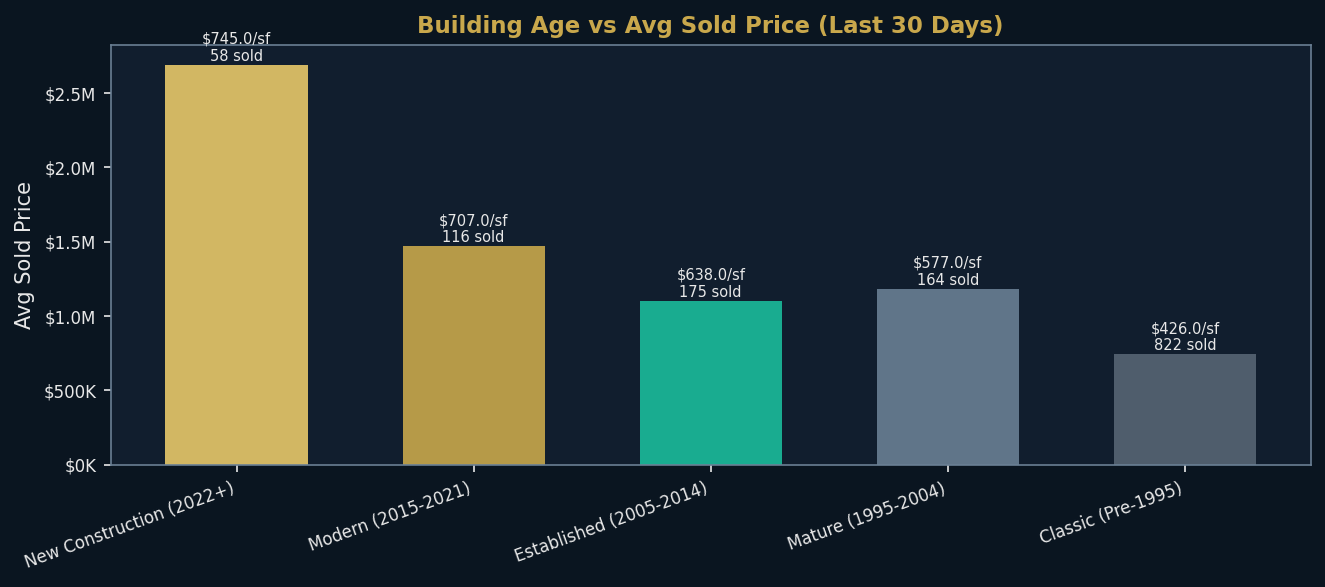
Building Age Premium [INSERT CHART HERE — Most Active Buildings]
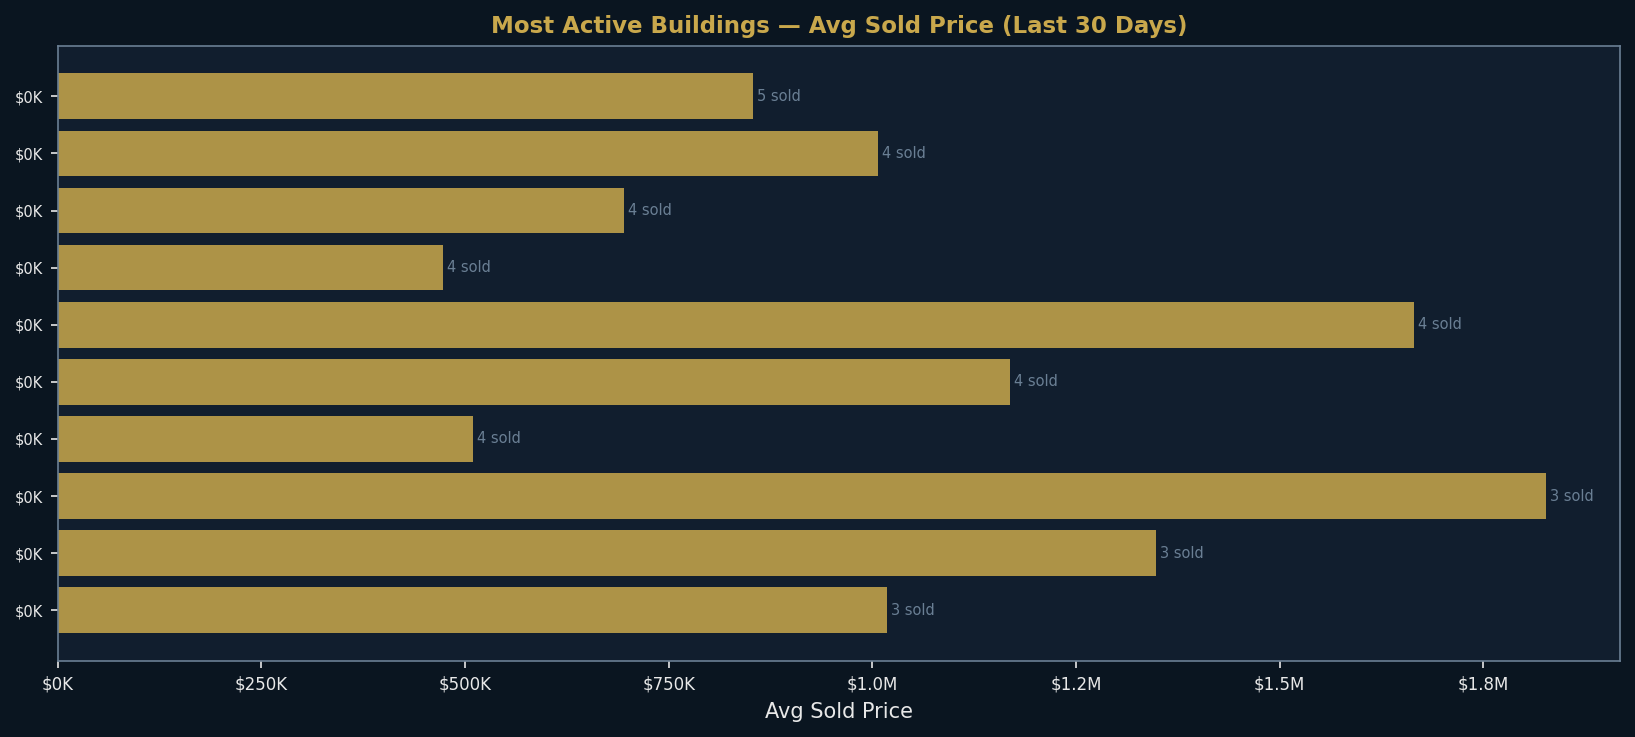
Most Active Buildings Talk to a Brickell Specialist
Need help comparing Brickell condos, timing a Miami move, or evaluating a new-construction opportunity? Speak with the Brickell Sold team.
